trend
Trend Signals Empower You to Make Money in the Stock Market
Submitted by Van Beek on May 17, 2011 - 09:20Simple trend signals let you ride the stock market and grow your savings
Stock market prices move in long-term trends. These trends cannot be predicted, but they can be recognized. You can get signals that indicate the direction of the trend in stock market index prices. And with the right trend signals, you can get a great long-term return on investment of your savings.
Stock Market Trends are More Reliable than Weather Forecasts
Submitted by Van Beek on May 3, 2011 - 04:01Long-term stock market trends are a great opportunity and change less than the weather
Stock market trends may tell you something about the future. But unlike weather forecasts, stock market trends say more about the coming months and less about tomorrow. They also do not predict exact numbers, like weather forecasts predict the temperature and wind speed for the coming week. But they do provide you with something more useful.
Common Questions About Trend Signals
Submitted by Van Beek on March 21, 2011 - 07:47
As one of our readers, you are welcome to send us any questions with regards to Trend Signals for the stock market and long-term investing. You can contact us here. Trend investing is simple, but when you are new to it, you probably will need some clarifications.
Here are a few questions that we received lately. Do not hesitate to send us your questions as well. You get a private answer by email and sometimes we use our answers as well for blog posts like this. Asking questions is always free.
Long term Nikkei and Yen Trend before the March 2011 Earthquake
Submitted by Van Beek on March 17, 2011 - 11:49The March 2011 earthquake, tsunami and nuclear disaster in Japan have a significant impact on the Japanese stock market index (Nikkei) and on the Japanese currency (Yen / JPY). But what were the long-term trends for the Nikkei and Yen before the disaster happened?
On this page you find a short video and the Prezi presentation that was used for the video.
You'll see what the long-term trend and moving averages trend signals were for the Nikkei and for the Yen versus the Dollar and the Euro.
For the Prezi presentation that is used in the video (no sound in the presentation itself), see below:
Will the earthquake in Japan change the long term trend for the Nikkei?
Submitted by Van Beek on March 15, 2011 - 06:33
The earthquake and the subsequent tsunami in Japan are a tremendous disaster. Thousands of people have died and many more lost their loved ones.
My sympathy goes to all victims. There could be even a catastrophe now with the nuclear power plant. But in the financial world there is no such thing as sympathy. It is all about profit and panic.
On March 14, the first trading day after the earthquake, the Nikkei lost 6.2% in value. Today, the 15th, at the moment of writing, the Nikkei has lost another 14%, probably fueled by the news on the nuclear radiation leaks. In one-and-half day, the Nikkei has now thus lost almost 20% of its value.
What do the S&P 500 Trend Signals Tell Us Now
Submitted by SP 500 on February 2, 2011 - 05:57
This video shows what the different Trend Signals tell us about the long-term trend in the S&P 500 at this moment.
The video explains also the different trend signals for the S&P 500 that are made available every month free of charge.
If there is something not clear or you have a question related to this video, please leave a comment.
Three Good Reasons Why You Want To Review Stock Market Trends Monthly
Submitted by Van Beek on November 9, 2010 - 05:11Are you still one of those investors who do not review the market trends and their stock market holdings regularly? Here are 3 good reasons to review your stock market investments every month.

As a long term investor, it is not advisable to review and check your stock portfolio daily. But at Stock Trend Investing we recommend to have every month a close look at the market and your investments. Here is why:
1) You do not want to miss a new emerging trend
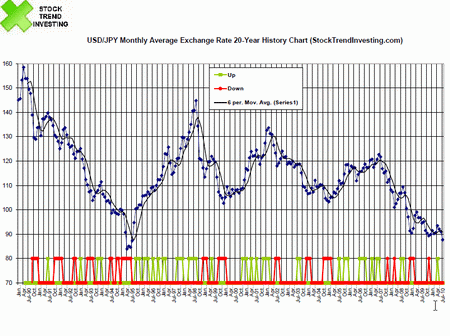
USD/JPY 20-Year Exchange Rate Trend and History Chart - July 2010
Submitted by Van Beek on August 10, 2010 - 02:55This USD/JPY exchange rate and trend chart shows a 20 year history. The US Dollar - Japanese Yen exchange rate is a lot in the news recently since a Dollar buys less and less Yen's. This is the historic perspective. The trend just continues. Click now here to see the historical trend investing performance and what level of results you can expect.

Warning for possible major down turn in US markets
Submitted by Van Beek on July 15, 2010 - 08:47HS Dent and his team predict a major decline in the US stock markets for the near future. They base their analysis on trends and cycles in demographics. Watch their video here.
EUR/USD Exchange Rate Trend and History Chart: 20 Years
Submitted by Van Beek on June 9, 2010 - 07:26This chart for the EUR/USD exchange rate and trend shows a 20 year history. Since the Euro exists only for about 10 years we had to make some calculations. You will see later below. 20 years provides a unique historic perspective.
Trends in currency exchange rates are important for investors who invest outside their home currency zone. A foreign stock market index could move up but the currency for that market could devalue compared to your home currency. In that case, your gains measured in your home currency would reduce or could even turn negative.


