- End of 12 Years of Monthly Stock Market Trend Updates
- Alternative Services for Trend Signals
- S&P 500 Trend Signal Email Alert
- Two Favorite Economics and Investment Newsletters
- Get Email Alert When S&P500 Trend Turns Down
- Currencies Impact Stock Market Profits
- Trend Investing Whip-Saw Reality
- Not Trend Following But Trend Investing
- How to Invest My Savings Safely for Good Long-Term Returns?
- Does Trend Trading the ASX Work?
Blogs
Why would Germany bail out investors in Greek debt? To save the Euro?
April 28, 2010 - 15:12 — Van BeekTwo issues that are raised in the discussions around the enormous Greek debt have surprised me. Let’s have a look at them and I am curious to hear what you think of them.
When we follow the news, we come across the following topics:
• Germany will or will not bail out Greece
• The Euro drops to the lowest rate in a year compared to the dollar
Let’s have a look at this Germany bailing out Greece and what the Euro has to do with it.
Are you asking your self these 7 important questions when stock investing?
April 20, 2010 - 05:20 — Van BeekHave you thought through well enough how you want to invest your money in the stock market? Stock investing is a very personal thing when you invest your own money. How you invest depends on the choices you make. It is easy to make these choices undeliberate and end up investing your money in a way that carries different risks than you would like to.
 To help us to make our investing choices in a deliberate way, at Stock Trend Investing we ask ourselves 7 important but basic questions on a regular basis. By answering these questions and acting accordingly, we ensure that we invest the way we want to invest.
Nasdaq Historic Trend Trading Chart - March 2010
April 8, 2010 - 11:24 — Van BeekEvery month, Stock Trend Investing is publishing one of its historic trend trading charts for free. This month, it is the trend trading chart or the Nasdaq.
The blue line shows the closing price of the Nasdaq index for that month.
The green line signals when our Initial Trend Expectation for the Nasdaq was "Up". The red line signals when our Initial Trend Expectation for the Nasdaq was "Down" or when there was a special warning.
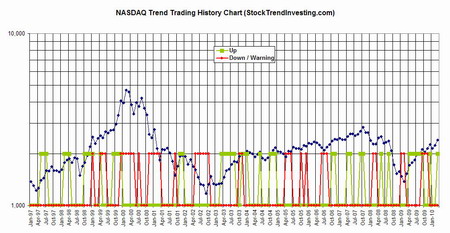
Click and drag the chart to a tab in your browser to see an enlargement.
Claim Your Free eBook:
"GROW YOUR SAVINGS &
AVOID THE DOWNTURNS"
and Get the Free Newsletter
that Helps You to Grow and
Protect Your Wealth

“Do you think that the interest you get from a Savings Account is too low? Do you expect higher profits than what you get from just buying and holding funds and stocks?
Do you like to receive simple signals and indicators that help you to decide what funds to buy and when to sell? Do you want to sell your funds before the stock market crashes?
If you answer any of these questions with a “Yes”, click here to read more about this long-term investment strategy that can also work very well for you. "
Grow Your Savings!

Founder/CEO Stock Trend Investing
 Syndicate