- End of 12 Years of Monthly Stock Market Trend Updates
- Alternative Services for Trend Signals
- S&P 500 Trend Signal Email Alert
- Two Favorite Economics and Investment Newsletters
- Get Email Alert When S&P500 Trend Turns Down
- Currencies Impact Stock Market Profits
- Trend Investing Whip-Saw Reality
- Not Trend Following But Trend Investing
- How to Invest My Savings Safely for Good Long-Term Returns?
- Does Trend Trading the ASX Work?
Blogs
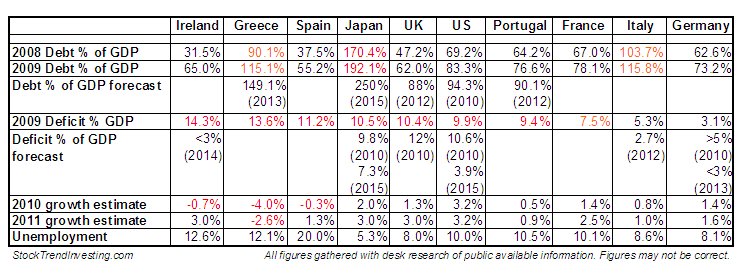
History of US federal debt as percentage of GDP: Why is this now important?
June 25, 2010 - 13:05 — ResearchThe increase in US federal debt as a percentage of GDP and in absolute terms is unprecedented and could therefore be a major risk for long term investors.
In this article we will see how the US federal debt has developed as a percentage of GDP for the last two centuries. We will point out why the growth is unprecedented even when the debt percentage has been higher in the past.
The next article following this one is about what is ahead for the US Dollar.
Dow Jones Industrial Averages DJIA Trend Trading History Chart - May 2010
June 16, 2010 - 02:51 — Van BeekEvery month, Stock Trend Investing is publishing one of its trend trading history charts for free. This month, it is the trend trading chart for the Dow Jones Industrial Averages (DJIA) index.
In the chart, the blue line shows the closing price of the Dow Jones Industrial Averages index for that month.
Click here to go to the free Guide on Trend Signals that tell you when to buy and sell.
Claim Your Free eBook:
"GROW YOUR SAVINGS &
AVOID THE DOWNTURNS"
and Get the Free Newsletter
that Helps You to Grow and
Protect Your Wealth

“Do you think that the interest you get from a Savings Account is too low? Do you expect higher profits than what you get from just buying and holding funds and stocks?
Do you like to receive simple signals and indicators that help you to decide what funds to buy and when to sell? Do you want to sell your funds before the stock market crashes?
If you answer any of these questions with a “Yes”, click here to read more about this long-term investment strategy that can also work very well for you. "
Grow Your Savings!

Founder/CEO Stock Trend Investing
 Syndicate