- End of 12 Years of Monthly Stock Market Trend Updates
- Alternative Services for Trend Signals
- S&P 500 Trend Signal Email Alert
- Two Favorite Economics and Investment Newsletters
- Get Email Alert When S&P500 Trend Turns Down
- Currencies Impact Stock Market Profits
- Trend Investing Whip-Saw Reality
- Not Trend Following But Trend Investing
- How to Invest My Savings Safely for Good Long-Term Returns?
- Does Trend Trading the ASX Work?
Van Beek's blog
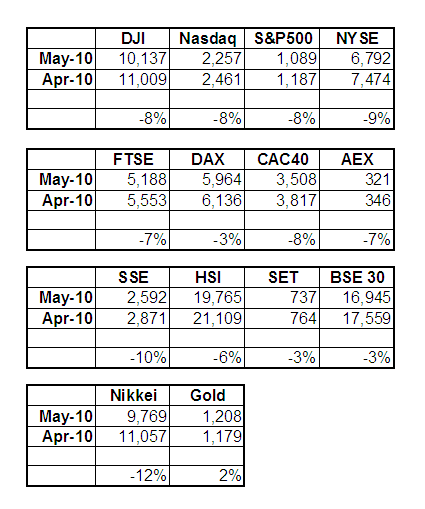
Which stock market indices declined most during May?
June 1, 2010 - 07:45 — Van BeekHow much did the different stock market indices actually decline during May? And which markets declined more, the US markets, the Asian markets or the European markets?
At Stock Trend Investing, we made a quick overview for you to get an answer to these questions. Some of the observations are surprising.
Would you invest at this moment in FTSE index funds?
May 26, 2010 - 04:55 — Van BeekMarkets are in turmoil. But maybe you have some savings that you want to invest. When you are living in the UK you may favour some FTSE index funds for example. However, is it now a good time to invest these savings?
Last week I got a question from a reader on what I thought about investing in the FTSE at this moment. I’ll come back on that later in this blog post. Let me first comment a little on last week. That was a week full of turmoil; not only in the financial markets but also in Bangkok, where I am living at this moment. Because of the unrest in Bangkok and the forced closing of the schools, we decided to go for a week to the beach on Koh Samui; great decision and great week.
BSE Sensex Trend Trading History Chart - April 2010
May 18, 2010 - 03:46 — Van BeekEvery month, Stock Trend Investing is publishing one of its trend trading history charts for free. This month, it is the trend trading chart or the Indian BSE Sensex.
The blue line shows the closing price of the BSE Sensex index for that month.
The green line signals when our Initial Trend Expectation for the BSE Sensex was "Up". The red line signals when our Initial Trend Expectation for the BSE Sensex was "Down" or when there was a special warning.
Find here the analysis on the correlation between the Nifty and the BSE Sensex.
Claim Your Free eBook:
"GROW YOUR SAVINGS &
AVOID THE DOWNTURNS"
and Get the Free Newsletter
that Helps You to Grow and
Protect Your Wealth

 Syndicate